Figure 1 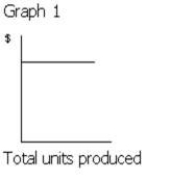
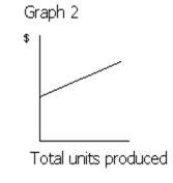
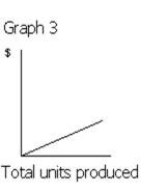
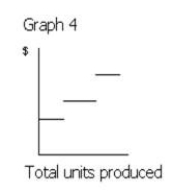
-Which of the following graphs in Figure 1 illustrates the behavior of a total variable cost?
A) Graph 2
B) Graph 3
C) Graph 4
D) Graph 1
Correct Answer:
Verified
Q63: Which of the following is not an
Q64: Which of the following is not an
Q65: A cost that has characteristics of both
Q67: Costs that vary in total in direct
Q68: The graph of a variable cost when
Q71: Costs that remain constant in total dollar
Q74: For purposes of analysis, mixed costs are
A)
Q75: Which of the following describes the behavior
Q79: Which of the following describes the behavior
Q82: Strait Co. manufactures office furniture. During the
Unlock this Answer For Free Now!
View this answer and more for free by performing one of the following actions

Scan the QR code to install the App and get 2 free unlocks

Unlock quizzes for free by uploading documents