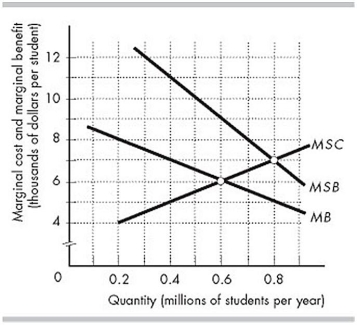
-The figure above shows the marginal social costs (MSC) , marginal private benefits (MB) , and marginal social benefits (MSB) of university education in Inland. The efficient level of university enrolment in Inland is
A) 0.5 million students per year.
B) 0.8 million students per year.
C) 0.6 million students per year.
D) 0.7 million students per year.
Correct Answer:
Verified
Q83: Q93: Q94: Which of the following scenarios would most Q95: Consider a market in which there is Q96: The economy's marginal social benefit curve for Q97: If it possible to prevent a person Unlock this Answer For Free Now! View this answer and more for free by performing one of the following actions Scan the QR code to install the App and get 2 free unlocks Unlock quizzes for free by uploading documents![]()
![]()

