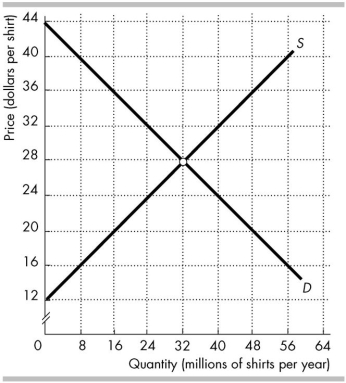
 The figure above shows the market for shirts in Australia, where D is the domestic demand curve and S is the domestic supply curve. The world price is $20 per shirt.
-In the figure above, international trade _______ consumer surplus in Australia by _______.
A) increases; $192 million
B) decreases; $192 million
C) increases; $320 million
D) decreases; $320 million
Correct Answer:
Verified
Q37: If a country imposes a tariff on
Q38: If a government imposes a quota on
Q39: When Australia imposes a tariff on a
Q40: During the Great Depression in the 1930s,
Q41: Which of the following is a true
Q43: An assumption behind the infant- industry argument
Unlock this Answer For Free Now!
View this answer and more for free by performing one of the following actions

Scan the QR code to install the App and get 2 free unlocks

Unlock quizzes for free by uploading documents