Multiple Choice
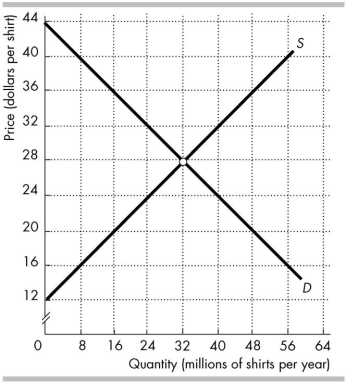 The figure above shows the market for shirts in Australia, where D is the domestic demand curve and S is the domestic supply curve. The world price is $20 per shirt.
-In the figure above, with international trade _______ million shirts per year are produced in Australia.
A) 16
B) 32
C) 20
D) 48
Correct Answer:
Verified
Related Questions
Q85: The United States has a comparative advantage
Q86: International trade is restricted because
A) free trade
Q87: Australian producer surplus _ when Australia imports
Unlock this Answer For Free Now!
View this answer and more for free by performing one of the following actions

Scan the QR code to install the App and get 2 free unlocks

Unlock quizzes for free by uploading documents