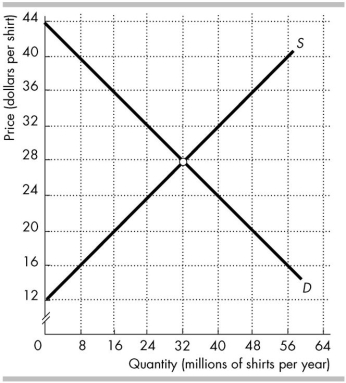
 The figure above shows the market for shirts in Australia, where D is the domestic demand curve and S is the domestic supply curve. The world price is $20 per shirt.
-In the figure above, international trade _______ total surplus in Australia by _______.
A) increases; $320 million
B) decreases; $192 million
C) decreases; $256 million
D) increases; $128 million
Correct Answer:
Verified
Q93: Which of the following statements is true?
A)
Q113: According to most economists, which of the
Q114: A country will export tyres if international
Q115: A key difference between tariffs and quotas
Q116: Tariffs
A) generate revenue for the government.
B) encourage
Q117: A tariff is imposed on a good.
Q119: In a market open to international trade,
Q120: Rent seeking is one reason why countries
Q122: A reason tariffs and quotas are imposed
Q123: Which of the following statements about Australian
Unlock this Answer For Free Now!
View this answer and more for free by performing one of the following actions

Scan the QR code to install the App and get 2 free unlocks

Unlock quizzes for free by uploading documents