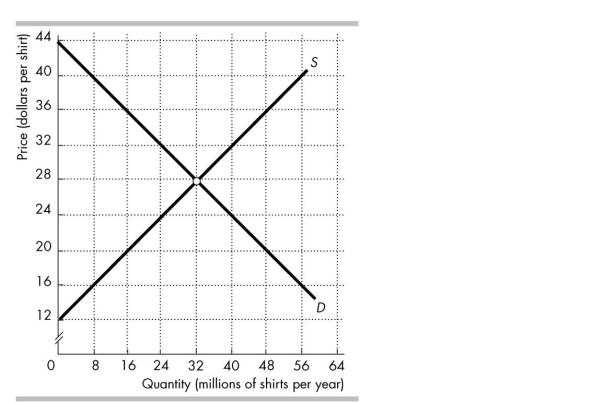
 The figure above shows the market for shirts in Australia, where D is the domestic demand curve and S is the domestic supply curve. The world price is $20 per shirt.
-In the figure above, with international trade Australia _______ million shirts per year.
A) exports 32
B) imports 48
C) exports 16
D) imports 32
Correct Answer:
Verified
Q125: A country opens up to trade and
Q126: Q127: The gains from free trade are enjoyed Q128: Tariffs _ consumer surplus and import quotas Q129: If Australia imposes a tariff on imported Q131: Currently Belize, a country in Central America, Q132: Prior to international trade, the price of Q133: Suppose the country of Mooland imposes a Q134: Consider a market in which there is Q135: When Australia imposes an import quota on![]()
Unlock this Answer For Free Now!
View this answer and more for free by performing one of the following actions

Scan the QR code to install the App and get 2 free unlocks

Unlock quizzes for free by uploading documents