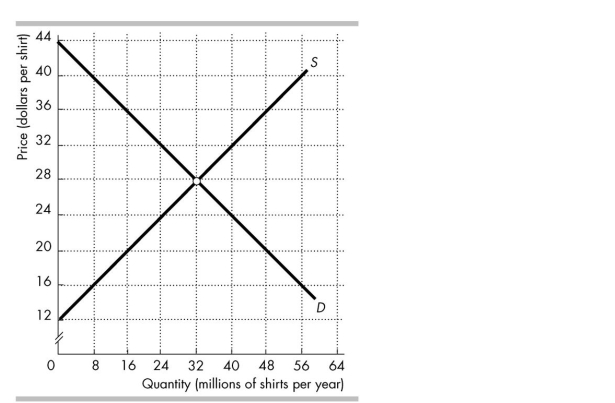
 The figure above shows the market for shirts in Australia, where D is the domestic demand curve and S is the domestic supply curve. The world price is $20 per shirt.
-In the figure above, international trade _______ producer surplus in Australia by _______ .
A) increases; $192 million
B) decreases; $320 million
C) increases; $320 million
D) decreases; $192 million
Correct Answer:
Verified
Q136: During the first 6 months of 2008,
Q137: Average tariff levels in Australia in the
Q138: The General Agreement on Tariffs and Trade
Q139: The most efficient way to encourage the
Q140: The argument that protection
A) penalises poor environmental
Q142: An import quota specifies the
A) minimum amount
Q143: A country opens up to trade and
Q144: When a rich nation buys a product
Q145: Suppose that the country of Pacifica imposes
Q146: Suppose sugar is exported from a nation.
Unlock this Answer For Free Now!
View this answer and more for free by performing one of the following actions

Scan the QR code to install the App and get 2 free unlocks

Unlock quizzes for free by uploading documents