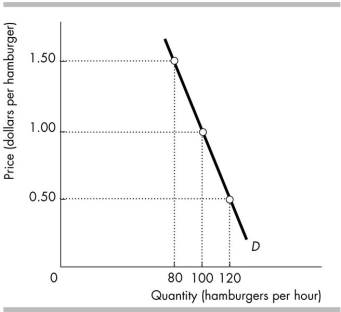
-The above figure illustrates the demand for hamburgers. When the price is $1 a hamburger, the elasticity of demand is _______ and a 1 per cent increase in the price will _______ the quantity of hamburgers demanded by _______ per cent.
A) 1.00; decrease; 0.40
B) 2.50; increase; 2.50
C) 5.00; decrease; 5.00
D) 0.40; decrease; 0.40
Correct Answer:
Verified
Q73: Q74: As time passes after a change in Q75: The price elasticity of demand is 5.0 Q76: If the price of a burger decreases Q77: If the demand for a good is Q79: The concept of elasticity of supply measures![]()
Unlock this Answer For Free Now!
View this answer and more for free by performing one of the following actions

Scan the QR code to install the App and get 2 free unlocks

Unlock quizzes for free by uploading documents