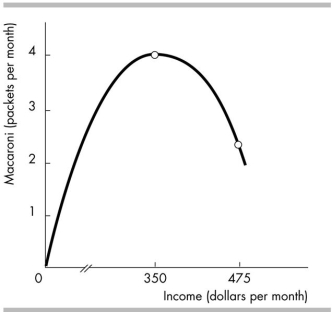
-The figure shows the relationship between Moira's income and the quantity of macaroni that she demands. When income is less than $350 per month, macaroni
A) is a normal good.
B) has many substitutes.
C) has negative income elasticity.
D) is an inferior good.
Correct Answer:
Verified
Q68: If the supply curve is vertical then
Q69: Q70: The price elasticity of demand for purses Q71: The elasticity of supply equals _ if Q72: The income elasticity of demand is a Q74: As time passes after a change in Q75: The price elasticity of demand is 5.0 Q76: If the price of a burger decreases Q77: If the demand for a good is Q78: ![]()
![]()
Unlock this Answer For Free Now!
View this answer and more for free by performing one of the following actions

Scan the QR code to install the App and get 2 free unlocks

Unlock quizzes for free by uploading documents