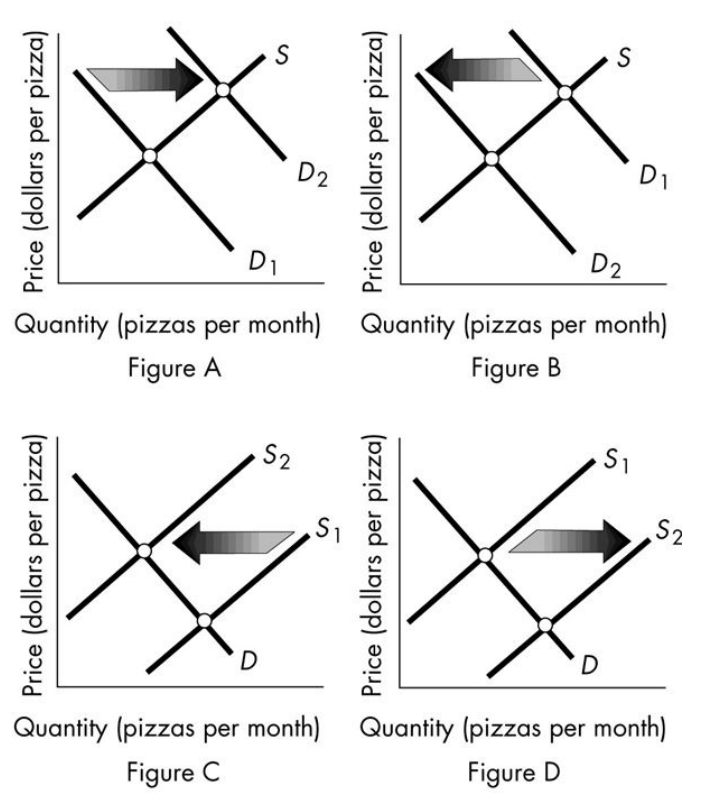
-The above figure shows the market for pizza. Which figure shows the effect of an increase in the price of a complement such as cola?
A) Figure A
B) Figure B
C) Figure C
D) Figure D
Correct Answer:
Verified
Q57: Suppose people buy more of good 1
Q97: A fall in the price of a
Q98: Normal goods are those for which demand
Q99: A change in which of the following
Q101: An increase in the number of suppliers
Q104: During the last decade, the price of
Q105: The equilibrium price is the price at
Q106: If consumers but not producers expect that
Q107: Which of the following decreases the supply
Q373: ![]()
Unlock this Answer For Free Now!
View this answer and more for free by performing one of the following actions

Scan the QR code to install the App and get 2 free unlocks

Unlock quizzes for free by uploading documents