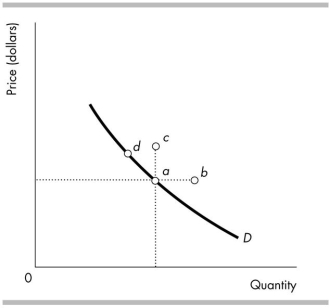
-In the above figure, an increase in the quantity demanded is represented by a movement from point d to
A) both points b and c.
B) point b only.
C) point c only.
D) point a.
Correct Answer:
Verified
Q85: If income decreases or the price of
Q122: An unusually warm winter shifts the
A) supply
Q123: When demand increases, the equilibrium price _and
Q124: Each point on a supply curve represents
A)
Q126: A complement is a good
A) of lower
Q128: Which of the following shifts the demand
Q129: Which of the following shifts the demand
Q130: When the price is below the equilibrium
Q131: When the price of a good falls,
Q132: ![]()
Unlock this Answer For Free Now!
View this answer and more for free by performing one of the following actions

Scan the QR code to install the App and get 2 free unlocks

Unlock quizzes for free by uploading documents