Multiple Choice
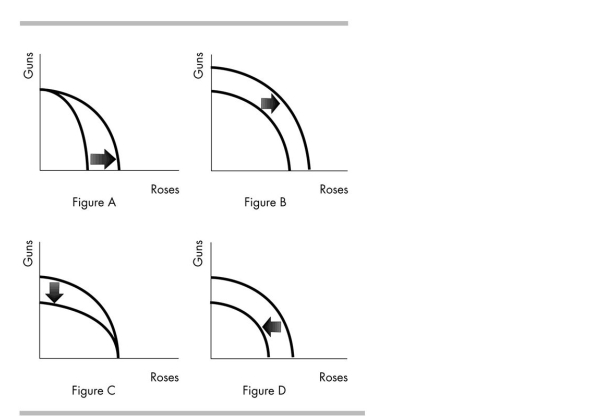
-Based on the above diagram, which figure shows the impact of a decrease in the population available to work?
A) Figure D
B) Figure B
C) Figure C
D) Figure A
Correct Answer:
Verified
Related Questions
Q51: Q52: Q53: Allocative efficiency occurs when Q54: Increasing opportunity cost occurs along a production Q55: Q57: Marginal cost is the _ one more Q59: A nation's production possibilities frontier is bowed Q60: Economic growth can be represented by Q202: Q213: Unlock this Answer For Free Now! View this answer and more for free by performing one of the following actions Scan the QR code to install the App and get 2 free unlocks Unlock quizzes for free by uploading documents![]()
![]()
A) marginal benefit exceeds![]()
A) an![]()
![]()

