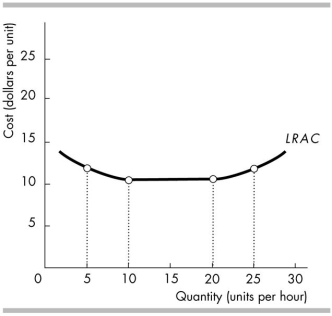
-In the above figure, the long- run average cost curve exhibits diseconomies of scale
A) between 5 and 10 units per hour.
B) between 10 and 20 units per hour.
C) along the entire curve.
D) between 20 and 25 units per hour.
Correct Answer:
Verified
Q100: When the marginal product of labour is
Q101: Q102: Q103: Profit maximisation Q104: A firm's average total cost is $100, Q106: The average product of labour is equal Q107: "Diminishing marginal returns" refer to a situation Q108: As output increases, marginal cost will eventually Unlock this Answer For Free Now! View this answer and more for free by performing one of the following actions Scan the QR code to install the App and get 2 free unlocks Unlock quizzes for free by uploading documents![]()
![]()
A) makes a firm remain small
A)

