Multiple Choice
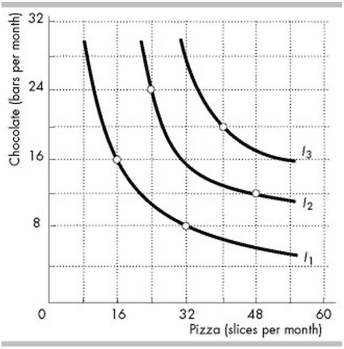
-The indifference curves in the figure above (I1, I2 and I3) reflect Peter's consumption preferences. Which of the following combinations of goods does Peter prefer the most?
A) 48 slices of pizza and 12 chocolate bars
B) 32 slices of pizza and 8 chocolate bars
C) 24 slices of pizza and 24 chocolate bars
D) 40 slices of pizza and 20 chocolate bars
Correct Answer:
Verified
Related Questions
Q6: Bob plans to spend $60 per month
Q26: Goods that can be bought in any
Q27: If green bikes and brown bikes are

