Multiple Choice
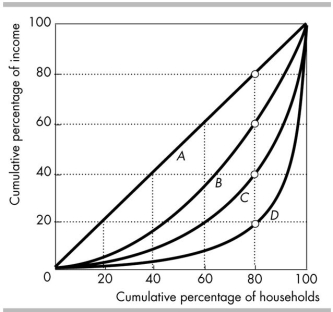
-In the figure above, line A represents the
A) line of equality.
B) line of equal number of people in each household.
C) line of equal consumption in each household.
D) line of disposable income distribution.
Correct Answer:
Verified
Related Questions

