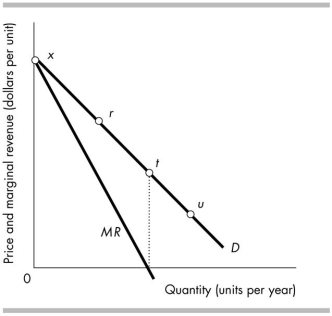
-The figure above shows a monopoly firm's demand curve. If the price and quantity of haircuts move from point t to point r, the monopoly's
A) total revenue will rise.
B) marginal revenue will decrease.
C) total revenue will remain the same.
D) total revenue will fall.
Correct Answer:
Verified
Q87: A price- discriminating monopolist
A) produces more output
Q88: In a small town, Marilyn's Christmas Tree
Q89: Monopolists are able to price discriminate because
A)
Q90: A monopoly is BEST defined as a
Q91: Q93: Patents encourage inventions because without a patent Q94: A price cap regulation _ . Unlock this Answer For Free Now! View this answer and more for free by performing one of the following actions Scan the QR code to install the App and get 2 free unlocks Unlock quizzes for free by uploading documents![]()
A)
A) is

