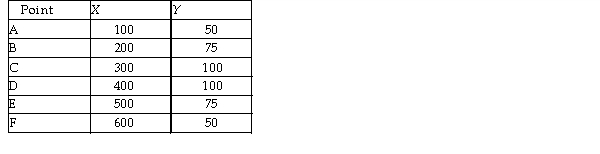
-In the table above, Y is measured along the y- axis and X along the x- axis. The slope between points E and F is
A) - 25.
B) 4.
C) - 0.25.
D) 0.25.
Correct Answer:
Verified
Q95: Opportunity cost is BEST defined as
A) all
Q96: You decide to take a vacation and
Q97: Which of the following is NOT a
Q99: When an economy produces more houses and
Q101: Ceteris paribus when graphing a relationship refers
Q102: Economics is BEST defined as
A) how people
Q103: Suppose we are considering the relationship between
Q104: Economic models
A) always use graphs.
B) simplify reality.
C)
Q105: Which of the following is a microeconomic
Q129: Which factor of production earns the most
Unlock this Answer For Free Now!
View this answer and more for free by performing one of the following actions

Scan the QR code to install the App and get 2 free unlocks

Unlock quizzes for free by uploading documents