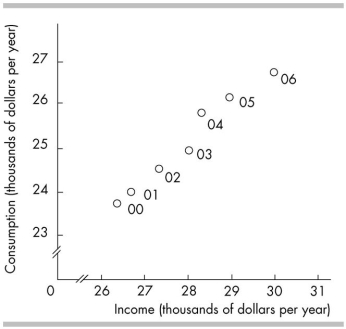
-In the above figure, the axis breaks are used
A) to indicate that there are not enough data to be included in the graph.
B) to indicate that there are jumps from the origin, 0, to the first values recorded along the axes.
C) to show that there are no data available for the omitted ranges.
D) to create a misleading graph.
Correct Answer:
Verified
Q106: Which of the following is a positive
Q107: The slope of a line equals the
A)
Q108: The loss of the highest- valued alternative
Q109: In economics, positive statements are about
A) microeconomics,
Q112: Entrepreneurs directly do all of the following
Q113: An incentive
A) is neither a reward nor
Q114: Differences in income are most directly related
Unlock this Answer For Free Now!
View this answer and more for free by performing one of the following actions

Scan the QR code to install the App and get 2 free unlocks

Unlock quizzes for free by uploading documents