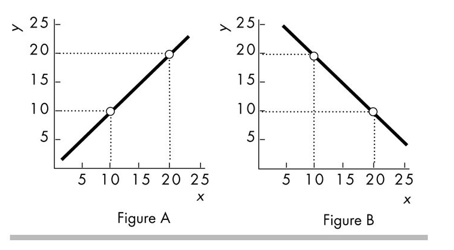
-In the above diagram, which figure shows a line with a slope of 1.0?
A) Figure A
B) Figure B
C) Both Figure A and Figure B
D) Neither Figure A nor Figure B
Correct Answer:
Verified
Q126: The opportunity cost of any action is
A)the
Q127: A positive statement is
A)about what is.
B)the result
Q128: The night before a midterm exam, you
Q129: Which factor of production earns the most
Q130: Jill, an economics student, has already spent
Q132: Which of the following is the BEST
Q133: Samantha goes to college to become an
Q134: Laura is a manager for HP. When
Q135: If the quantity of wood purchased decreases
Q576: ![]()
Unlock this Answer For Free Now!
View this answer and more for free by performing one of the following actions

Scan the QR code to install the App and get 2 free unlocks

Unlock quizzes for free by uploading documents