Use the scatter diagrams to verify which statements are correct:
Chart A 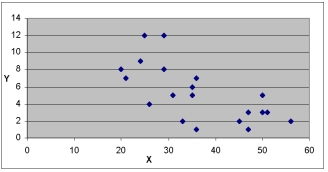
Chart B 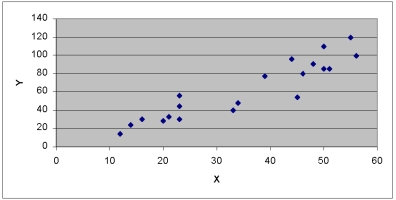
Chart C 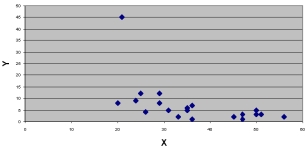
A) The variables in Chart A have a strong positive correlation
B) The variables in Chart C have a strong positive correlation
C) The variables in Chart B have a negative correlation
D) Charts A & B have no obvious outliers
E) None of the choices are correct
Correct Answer:
Verified
Q54: If the correlation between two variables is
Q69: i. Correlation analysis is a group of
Q71: i. A coefficient of correlation r close
Q72: i. Perfect correlation means that the scatter
Q74: i. The coefficient of correlation is a
Q77: Which of the following statements regarding the
Q78: i. If the coefficient of correlation is
Q78: If r = 0.65, what does the
Q91: i. If there is absolutely no relationship
Q95: i. If the coefficient of correlation is
Unlock this Answer For Free Now!
View this answer and more for free by performing one of the following actions

Scan the QR code to install the App and get 2 free unlocks

Unlock quizzes for free by uploading documents