The following distribution table represents preferences for two types of cereals by 2,000 boys and girls. 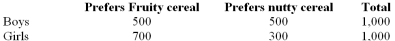 Find the probability that a person prefers Fruity cereal given that the person is a boy.
A) 500/1,000
B) 500/2,000
C) 1,200/2,000
D) 500/1,200
E) None of the choices are correct
Correct Answer:
Verified
Q40: A tire manufacturer advertises, "the median life
Q41: An automatic machine inserts mixed vegetables into
Q42: The following distribution table represents preferences for
Q43: The following distribution table represents preferences for
Q45: A study of the opinion of designers
Q47: A study of the opinion of designers
Q48: Three defective electric toothbrushes were accidentally shipped
Unlock this Answer For Free Now!
View this answer and more for free by performing one of the following actions

Scan the QR code to install the App and get 2 free unlocks

Unlock quizzes for free by uploading documents