Listed below is the box plot of average earnings ratio for full-year, full-time male workers from 1999 to 2008: 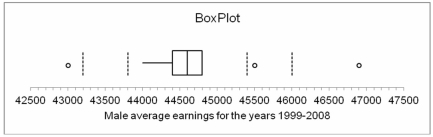 From this we can interpret that the maximum average earnings for men for the years 1999-2008 was approximately:
A) $44,000
B) $44,400
C) $44,800
D) $45,600
E) $46,900
Correct Answer:
Verified
Q78: The value that occurs most often in
Q128: What is the size of the sample?
A)
Q129: Listed below is the box plot of
Q130: If a distribution is highly skewed, the
Q131: Listed below is the box plot of
Q133: Determine the age of the youngest person
Q135: Listed below is the box plot of
Q136: For the_ (measure of central tendency), the
Q137: The weekly sales from a sample of
Q138: Describe the shape of the age of
Unlock this Answer For Free Now!
View this answer and more for free by performing one of the following actions

Scan the QR code to install the App and get 2 free unlocks

Unlock quizzes for free by uploading documents