The table of values was generated by a graphing utility with a Table feature. Use the following table to solve. 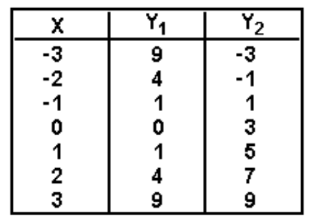
- Does the graph of Y1 pass through the origin?
Correct Answer:
Verified
Q18: Match the correct viewing rectangle dimensions with
Q19: Plot the given point in a rectangular
Q20: Graph the equation.
-y = 3x - 1
Q21: Use the graph to determine the x-
Q22: Match the correct viewing rectangle dimensions with
Q22: The graph shows the recorded hourly temperatures
Q24: Use the graph to determine the x-
Q26: The table of values was generated by
Q27: The table of values was generated by
Q28: Use the graph to determine the x-
Unlock this Answer For Free Now!
View this answer and more for free by performing one of the following actions

Scan the QR code to install the App and get 2 free unlocks

Unlock quizzes for free by uploading documents