Use the graph to determine the x- and y-intercepts.
-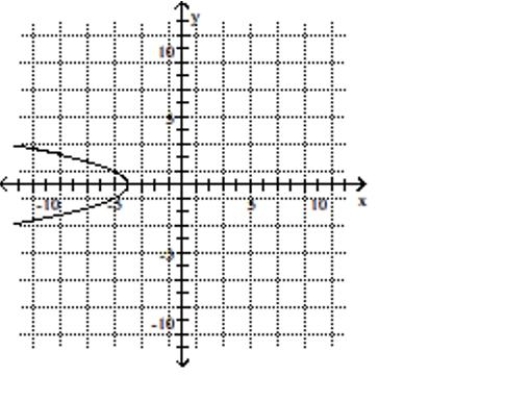
A) y-intercept: -4
B) y-intercept: 4
C) x-intercept: 4
D) x-intercept: -4
Correct Answer:
Verified
Q22: The graph shows the recorded hourly temperatures
Q24: Use the graph to determine the x-
Q26: The table of values was generated by
Q27: The table of values was generated by
Q28: Use the graph to determine the x-
Q30: The line graph shows the recorded hourly
Q32: The line graph shows the recorded hourly
Q33: Use the graph to determine the x-
Q34: The line graph shows the recorded hourly
Q152: The line graph shows the recorded hourly
Unlock this Answer For Free Now!
View this answer and more for free by performing one of the following actions

Scan the QR code to install the App and get 2 free unlocks

Unlock quizzes for free by uploading documents