The following scatterpolt shows the percentage of the vote a candidate received in the 2004 senatoral elections according to the voter's income level based on an exit poll of the voters conducted bu CNN. The income levels 1-8 correspond to the followng income classes: 1=under $15,00; 2=$15-30,000; 3=$30-50,000; 4=$50=75,000; 5=$75-100,000; 6=$100-150,000; 7=$150=200,000; 8=$200,000 or more.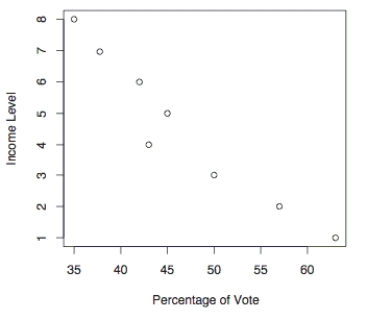
Use the election scatterplot to the find the critical values corresponding to a 0.01 significance level used to test the null hypothesis of Ps=0 .
A) -0.881 and 0.881
B) -0.881
C) -0.738 and 0.738
D) 0.881
Correct Answer:
Verified
Q36: Use the runs test to determine
Q37: Use a Kruskal-Wallis test to test
Q38: A teacher uses two different CAI programs
Q39: Use the sign test to test
Q40: Use the runs test to determine whether
Q42: The following scatterpolt shows the percentage of
Q43: Which statement is false about the Wilcoxon
Q44: Which of the following terms is sometimes
Q45: Which of the following is not an
Q46: Find the critical value. Assume that
Unlock this Answer For Free Now!
View this answer and more for free by performing one of the following actions

Scan the QR code to install the App and get 2 free unlocks

Unlock quizzes for free by uploading documents