The following table gives the US domestic oil production rates (excluding Alaska) from 1987 to 2002. A regression equation was fit to the data and the residual plot is shown below.
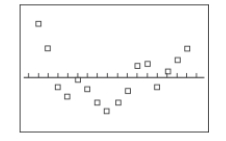
Does the residual plot suggest that the regression equation is a bad model? why or why not?
Correct Answer:
Verified
View Answer
Unlock this answer now
Get Access to more Verified Answers free of charge
Q50: A regression equation is obtained for a
Q51: Give an example of a pair of
Q52: The table lists the value y
Q53: The following residual plot is obtained after
Q54: Sketch an example of a residual plot
Q55: Describe what scatterplots are and discuss the
Q56: Describe the standard error of estimate,
Q57: The table below lists weights (carats)
Q58: Sketch a sample scatterplot of at least
Q60: When testing to determine if correlation
Unlock this Answer For Free Now!
View this answer and more for free by performing one of the following actions

Scan the QR code to install the App and get 2 free unlocks

Unlock quizzes for free by uploading documents