As with many other construction materials, the price of gravel (per ton) depends on the quantity of material ordered. The following table presents the unit cost (dollars/ton) for gravel for various order sizes (in tons)
Which of the following graphs is the correct residual plot for the data set? (Hint: create your own)
residual plot and compare it to those shown below.
A) 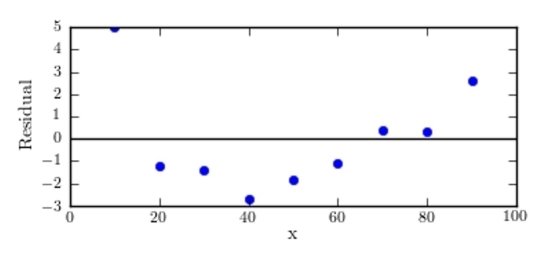
B) 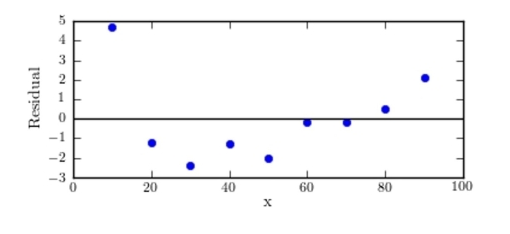
C) 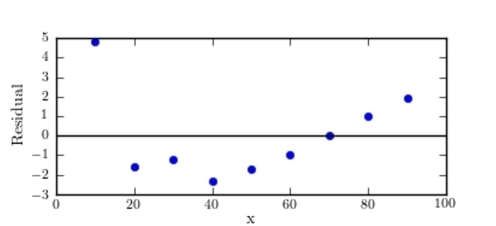
D) 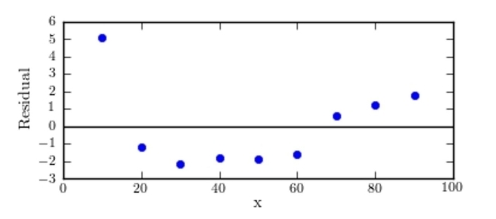
Correct Answer:
Verified
Q20: One of the primary feeds for
Q21: An automotive engineer computed a least-squares
Q22: For the following data set, how
Q23: For the following data set, compute
Q24: An automotive engineer computed a least-squares
Q25: The following MINITAB output presents the
Q27: The following MINITAB output presents the
Q28: MINITAB-style residual plots are shown below. Which
Q29: Of points 1, 2, and 3 shown
Q30: As with many other construction materials,
Unlock this Answer For Free Now!
View this answer and more for free by performing one of the following actions

Scan the QR code to install the App and get 2 free unlocks

Unlock quizzes for free by uploading documents