Thirty households were surveyed for the number of televisions in each home. Following are the results.
Construct a frequency histogram.
A) 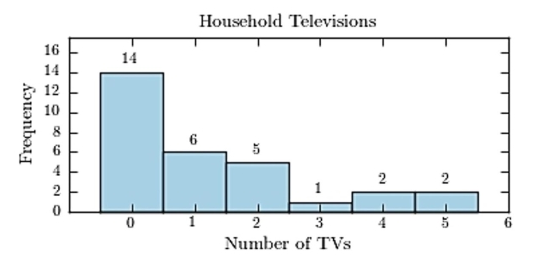
B) 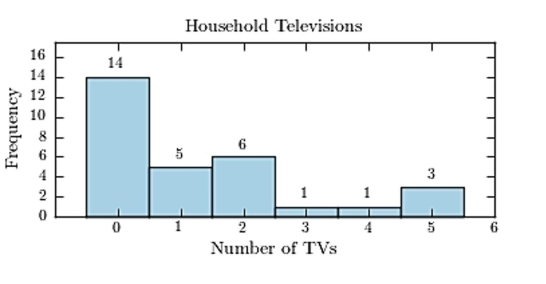
C) 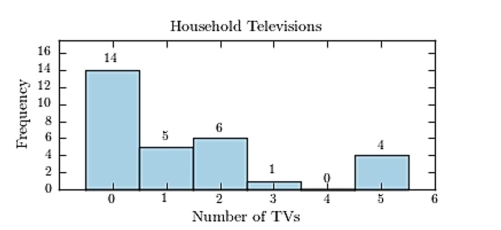
D) 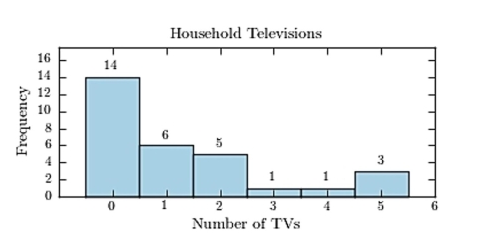
Correct Answer:
Verified
Q19: The following frequency distribution presents the weights
Q20: The following frequency distribution presents the
Q21: Which of the following presents the most
Q22: Which of the following presents the most
Q23: Construct a dotplot for the following
Q25: Construct a dotplot for the following
Q26: Following are the numbers of Dean's
Q27: A sample of 200 high school students
Q28: Construct a stem-and-leaf plot for the
Q29: Thirty households were surveyed for the
Unlock this Answer For Free Now!
View this answer and more for free by performing one of the following actions

Scan the QR code to install the App and get 2 free unlocks

Unlock quizzes for free by uploading documents