The football coach at State University wishes to determine if there is a decrease in offensive production between the first half and the second half of his team's recent games. The table below shows the first-half and second-half offensive production (measured in total yards gained per half) for the past six games.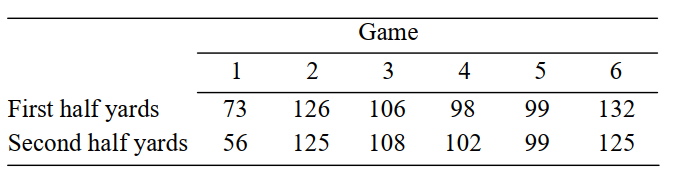
Can you conclude that the mean offensive production in the first half differed from that of
the second half?
i). State the null and alternative hypotheses.
ii). Compute the test statistic.
iii). State a conclusion using the α = 0.10 level of significance.
Correct Answer:
Verified
ii).
iii). Do not reject...
View Answer
Unlock this answer now
Get Access to more Verified Answers free of charge
Q21: Find the critical value
Q22: Following is a sample of five
Q23: The bowling scores of a professional
Q24: Following is a sample of five
Q25: he following MINITAB output display presents
Q27: An F-test with 13 degrees of
Q28: The football coach at State University
Q29: The following display from a TI-84
Q30: In an experiment to determine whether there
Q31: A broth used to manufacture a
Unlock this Answer For Free Now!
View this answer and more for free by performing one of the following actions

Scan the QR code to install the App and get 2 free unlocks

Unlock quizzes for free by uploading documents