The graph shown below represents a company's profit (y-axis)in dollars based on the number of items (x-axis)produced by the company. 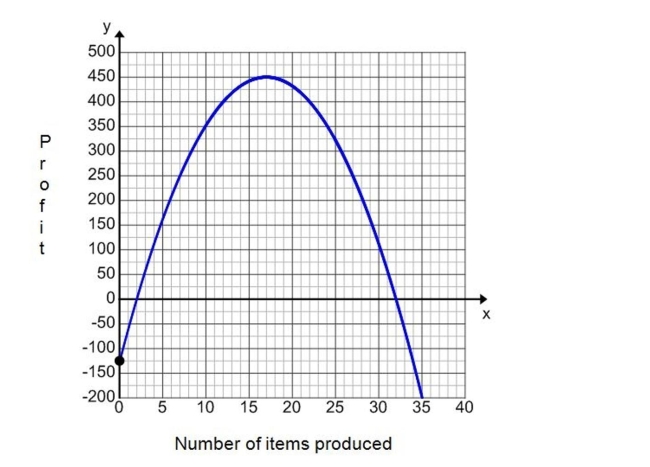
a. What is the y-intercept of this graph? What does it represent?
b. What are the x-intercepts of this graph? What do they represent?
c. What is the maximum amount of profit this company can earn?
d. How many items must the company produce in order to reach the maximum profit?
Correct Answer:
Verified
View Answer
Unlock this answer now
Get Access to more Verified Answers free of charge
Q140: When factoring a trinomial of the form
Q141: The number of miles that light travels
Q142: 
Q143: Write the number in scientific notation.
A red
Q144: According to the National Association of Realtors,
Q146: Q147: Heartbreak Hill is a hill on the Q148: In 2000, the population of Sheboygan, WI Q149: Factor completely. Q150: If a person takes a 40 mg![]()
![]()
Unlock this Answer For Free Now!
View this answer and more for free by performing one of the following actions

Scan the QR code to install the App and get 2 free unlocks

Unlock quizzes for free by uploading documents