The price per share of stock (in dollars)over a period of 5 days is shown in the
graph. 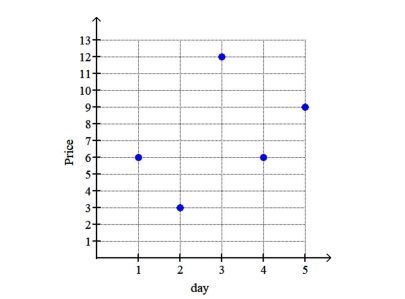 What was the loss between day 3 and day 4?
Correct Answer:
Verified
Q18: Complete the table of points for the
Q19: Find the slope and y-intercept of the
Q20: Solve the system using the graphing method.
Q21: x varies directly as
Q22: Sketch the graph of 2x = 11.
Q24: Determine if the given point is a
Q25: Find the slope and y-intercept of the
Q26: Find the slope of the line connecting
Q27: Sketch the graph of the equation.
4x +
Q28: Find the slope of the line that
Unlock this Answer For Free Now!
View this answer and more for free by performing one of the following actions

Scan the QR code to install the App and get 2 free unlocks

Unlock quizzes for free by uploading documents