The table displays the number of women in the US House of Representatives for selected years from 1980 through 2008. 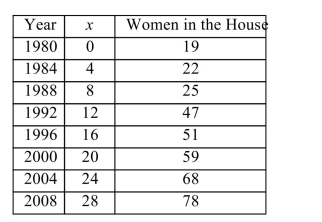
a. Use your calculator to determine the line of best fit for these data, where x is the number of years since 1980. Round all coefficients to 4 decimal places.
b. What is the correlation coefficient, r? What does it mean about whether this line is a good fit for these data? Explain.
c. Give the slope of the line and explain what it means.
d. Use this equation to predict the number of women in the House of Representatives in the year 2013.
Correct Answer:
Verified
Q61: Of all the topics we have covered
Q62: Mountain climbers use a general rule of
Q63: B varies directly as
Q64: The following table reports the number of
Q65: Find the slope of the line connecting
Q66: The cost, in dollars, of filling your
Q68: My spouse was recently in Mexico, and
Q69: L varies jointly as
Q70: The following table shows the cost of
Q71: True story from Erin's life: My 4-month
Unlock this Answer For Free Now!
View this answer and more for free by performing one of the following actions

Scan the QR code to install the App and get 2 free unlocks

Unlock quizzes for free by uploading documents