Use the frequency distribution to answer the next questions. A sample of 272
log jams found in river channels in the Northwest U.S. is grouped into the resulting
frequency distribution based on the width of the channel in which the log jams
were found. 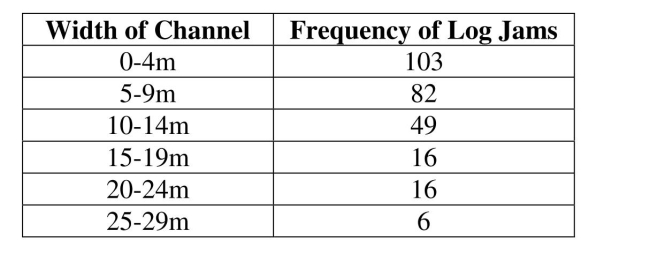
-Construct a corresponding histogram for the width of the channels.
Correct Answer:
Verified
View Answer
Unlock this answer now
Get Access to more Verified Answers free of charge
Q21: Use the following sample data for the
Q22: Use the following sample data for the
Q23: If a cumulative frequency distribution were constructed
Q24: Use the frequency distribution to answer the
Q25: If a relative frequency distribution were constructed
Q27: The distribution of the histogram for the
Q28: Use the following sample data for the
Q29: Use the following data for the next
Q30: Use the following sample data for the
Q31: Use the following sample data for the
Unlock this Answer For Free Now!
View this answer and more for free by performing one of the following actions

Scan the QR code to install the App and get 2 free unlocks

Unlock quizzes for free by uploading documents