
Related Questions
Q192: Solve.
hat
-In 1995 , the average annual
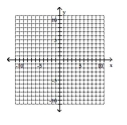
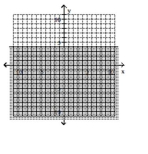
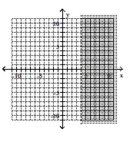
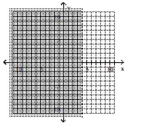
Q193: Graph the inequality. Q194: Graph the inequality. Q195: Graph the inequality. Q196: Graph the inequality. Q198: Graph the inequality. Q199: Graph the inequality. Q200: Graph the inequality. Q201: Graph the union or intersection, as Q202: Graph the union or intersection, as Unlock this Answer For Free Now! View this answer and more for free by performing one of the following actions Scan the QR code to install the App and get 2 free unlocks Unlock quizzes for free by uploading documents
-
-
-
-
-
-
-

