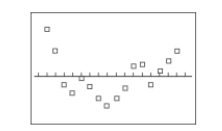
The following table gives the US domestic oil production rates (excluding Alaska)from 1987
to 2002. A regression equation was fit to the data and the residual plot is shown below.
Correct Answer:
Verified
View Answer
Unlock this answer now
Get Access to more Verified Answers free of charge
Q43: For each of 200 randomly selected cities,
Q45: A set of data consists of
Q46: Describe the standard error of estimate, se.
Q46: Suppose there is significant correlation between two
Q47: Applicants for a particular job, which
Q49: Define the terms predictor variable and response
Q51: The following residual plot is obtained after
Q53: The table below lists weights (carats)and
Q54: When testing to determine if correlation
Q55: The results for several randomly selected
Unlock this Answer For Free Now!
View this answer and more for free by performing one of the following actions

Scan the QR code to install the App and get 2 free unlocks

Unlock quizzes for free by uploading documents