Find the area of the shaded region. The graph depicts the standard normal distribution with mean 0 and standard deviation 1. 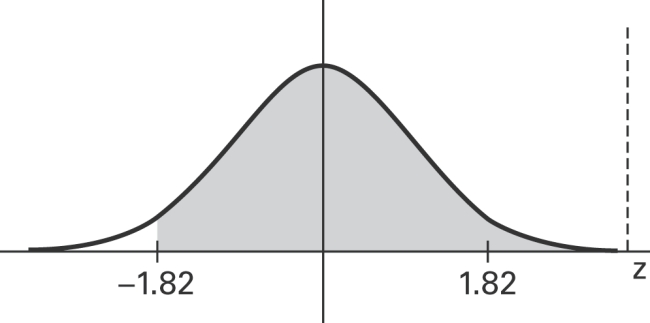
A) 0.4656
B) 0.9656
C) 0.0344
D) −0.0344
Correct Answer:
Verified
Q1: Find the probability that in 200 tosses
Q3: If z is a standard normal variable,
Q3: Estimate the probability of getting exactly 43
Q4: For women aged 18-24, systolic blood pressures
Q5: A bank's loan officer rates applicants
Q5: The given values are discrete. Use the
Q6: The continuity correction is used to compensate
Q10: For the binomial distribution with n=24
Q12: Assume that the weight loss for
Q17: A study of the amount of time
Unlock this Answer For Free Now!
View this answer and more for free by performing one of the following actions

Scan the QR code to install the App and get 2 free unlocks

Unlock quizzes for free by uploading documents