Find the indicated z score. The graph depicts the standard normal distribution with mean 0 and standard deviation 1. Shaded area is 0.4483. 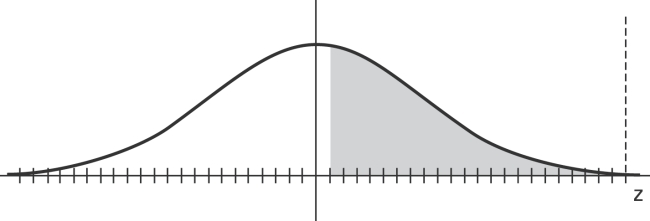
A) −0.13
B) 0.3264
C) 0.6736
D) 0.13
Correct Answer:
Verified
Q18: The distribution of certain test scores
Q18: If a sample size is < _,
Q19: Scores on a test have a
Q19: Estimate the indicated probability by using the
Q20: Assume that z scores
Q22: The Precision Scientific Instrument Company manufactures thermometers
Q22: The given values are discrete. Use the
Q24: Assume that the red blood cell counts
Q25: The probability that a radish seed will
Q26: A baseball player has a batting average
Unlock this Answer For Free Now!
View this answer and more for free by performing one of the following actions

Scan the QR code to install the App and get 2 free unlocks

Unlock quizzes for free by uploading documents