A normal quartile plot is given below for a sample of scores on an aptitude test. Use the
plot to assess the normality of scores on this test. Explain your reasoning. 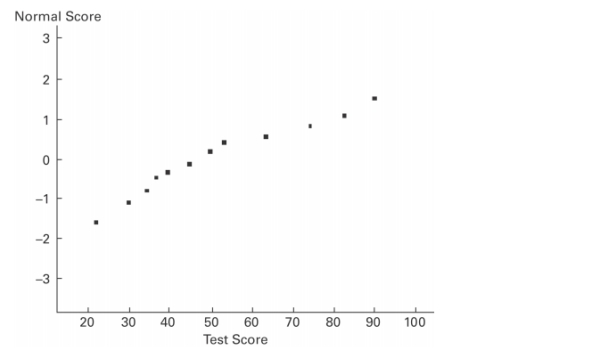
Correct Answer:
Verified
View Answer
Unlock this answer now
Get Access to more Verified Answers free of charge
Q42: The number of books sold over the
Q44: The population of current statistics students
Q44: After constructing a new manufacturing machine, five
Q48: Three randomly selected households are surveyed as
Q51: Describe what an unbiased estimator is and
Q51: A normal quartile plot is given below
Q53: Suppose that you wish to find
minimum of
Q54: In a recent year, the U.S. Mint
Q57: State the central limit theorem. Describe the
Q58: Define the central limit theorem and its
Unlock this Answer For Free Now!
View this answer and more for free by performing one of the following actions

Scan the QR code to install the App and get 2 free unlocks

Unlock quizzes for free by uploading documents