The histogram below represents the number of television sets per household for a sample of_ U.S. households. What is the sample size? Number of TV Sets Per U.S. Household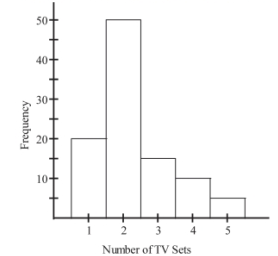
A) 5
B) 50
C) 90
D) 100
Correct Answer:
Verified
Q30: Attendance records at a school show
Q31: The following data consists of the
Q32: The following data represent the number
Q33: The frequency distribution below summarizes the
Q34: Wagenlucht Ice Cream Company is always trying
Q36: The frequency distribution below summarizes the
Q37: The ages of the 45 members
Q38: The Kappa Iota Sigma Fraternity polled its
Q39: The following frequency distribution displays the
Q40: The following data show the number
Unlock this Answer For Free Now!
View this answer and more for free by performing one of the following actions

Scan the QR code to install the App and get 2 free unlocks

Unlock quizzes for free by uploading documents