A manufacturer records the number of errors each work station makes during the week. The data are as follows.
Which of these choices display the correct dotplot?
A) Number of Errors for the Week for Workstations 
B) Number of Errors for the Week for Workstations 
C) Number of Errors for the Week for Workstations 
D) Number of Errors for the Week for Workstations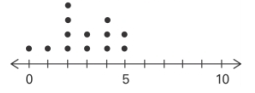
Correct Answer:
Verified
Q23: A nurse measured the blood pressure
Q24: Identify the cumulative frequency distribution that
Q25: The following frequency distribution depicts the
Q26: According to USA Today, the largest categories
Q29: A nurse measured the blood pressure of
Q30: Attendance records at a school show
Q31: The following data consists of the
Q32: The following data represent the number
Q33: The frequency distribution below summarizes the
Q35: The linear _ coefficient denoted by r
Unlock this Answer For Free Now!
View this answer and more for free by performing one of the following actions

Scan the QR code to install the App and get 2 free unlocks

Unlock quizzes for free by uploading documents