Consider a situation where Y is related to X in the following manner:
Draw the deterministic part of the above function. Next add, in the same graph, a hypothetical Y, X scatterplot of the actual observations. Assume that you have misspecified the functional form of the regression function and estimated the relationship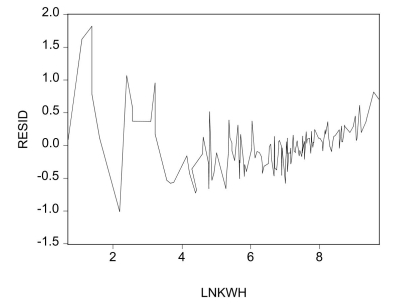
between Y and X using a linear regression function. Add this linear regression function to your graph. Separately, show what the plot of the residuals against the X variable in your regression would look like.
Correct Answer:
Verified
View Answer
Unlock this answer now
Get Access to more Verified Answers free of charge
Q39: In the case of errors-in-variables bias,
Q40: The errors-in-variables model analyzed in the
Q41: Your textbook uses the following example
Q42: Your textbook has analyzed simultaneous equation
Q43: Give at least three examples where
Q45: Your textbook states that correlation of the
Q46: In the simple, one-explanatory variable, errors-in-variables
Q47: In macroeconomics, you studied the equilibrium
Q48: Consider the one-variable regression model,
Q49: Your textbook only analyzed the case
Unlock this Answer For Free Now!
View this answer and more for free by performing one of the following actions

Scan the QR code to install the App and get 2 free unlocks

Unlock quizzes for free by uploading documents