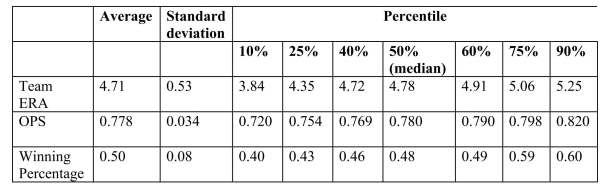
You have collected data from Major League Baseball (MLB)to find the determinants of
winning.You have a general idea that both good pitching and strong hitting are needed to do
well.However, you do not know how much each of these contributes separately.To
investigate this problem, you collect data for all MLB during 1999 season.Your strategy is to
first regress the winning percentage on pitching quality ("Team ERA"), second to regress the
same variable on some measure of hitting ("OPS - On-base Plus Slugging percentage"), and
third to regress the winning percentage on both.
(a)Use the t-statistic to test for the statistical significance of the coefficient.
Correct Answer:
Verified
View Answer
Unlock this answer now
Get Access to more Verified Answers free of charge
Q23: A subsample from the Current Population
Q24: In the multiple regression model with
Q26: The cost of attending your college
Q27: Set up the null hypothesis and alternative
Q29: At a mathematical level, if the
Q30: If the estimates of the coefficients of
Q30: Attendance at sports events depends on
Q31: Females, on average, are shorter and
Q32: All of the following are true,
Q33: In the process of collecting weight
Unlock this Answer For Free Now!
View this answer and more for free by performing one of the following actions

Scan the QR code to install the App and get 2 free unlocks

Unlock quizzes for free by uploading documents