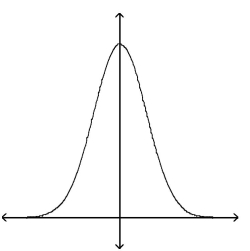
A) The graph can represent a normal density function.
B) The graph cannot represent a normal density function because it has no inflection points.
C) The graph cannot represent a normal density function because as x increases without bound, the graph takes negative values.
D) The graph cannot represent a normal density function because the area under the graph is greater than 1.
Correct Answer:
Verified
Q5: Find the area under the standard normal
Q6: Find the area under the standard normal
Q13: A random number generator is set top
Q14: The graph of a normal curve
Unlock this Answer For Free Now!
View this answer and more for free by performing one of the following actions

Scan the QR code to install the App and get 2 free unlocks

Unlock quizzes for free by uploading documents