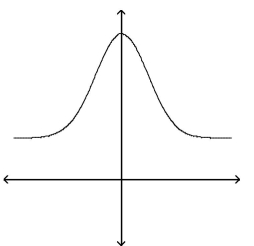
A) The graph cannot represent a normal density function because it does not approach the horizontal axis as x increases or decreases without bound.
B) The graph cannot represent a normal density function because it is not bell shaped.
C) The graph can represent a normal density function.
D) The graph cannot represent a normal density function because it has no inflection points.
Correct Answer:
Verified
Q1: Find the area under the standard normal
Q8: Find the area under the standard normal
Q9: Find the area under the standard normal
Q14: Find the sum of the areas under
Q31: The weight of 2-year old hyraxes is
Q35: True or False: The area under the
Q38: True or False: The proportion of the
Unlock this Answer For Free Now!
View this answer and more for free by performing one of the following actions

Scan the QR code to install the App and get 2 free unlocks

Unlock quizzes for free by uploading documents