Determine whether the following normal probability plot indicates that the sample data could have come froma population that is normally distributed. 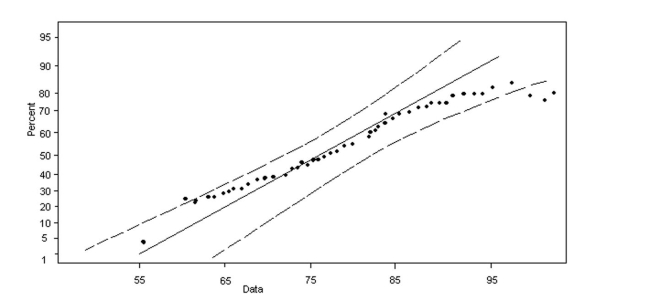
A) not normally distributed
B) normally distributed
Correct Answer:
Verified
Q92: Determine whether the following normal probability plot
Q93: The following data represent a random
Q94: Determine whether the following normal probability plot
Q95: A physical fitness association is including the
Q96: The amount of corn chips dispensed into
Q98: The board of examiners that administers the
Q99: An industrial psychologist conducted an experiment
Q100: The amount of soda a dispensing machine
Q101: In a recent survey, 84% of the
Q102: According to government data, the probability than
Unlock this Answer For Free Now!
View this answer and more for free by performing one of the following actions

Scan the QR code to install the App and get 2 free unlocks

Unlock quizzes for free by uploading documents