The graph below is an ogive of scores on a math test. The vertical axis in an ogive is the cumulative relativefrequency and can also be interpreted as a percentile. 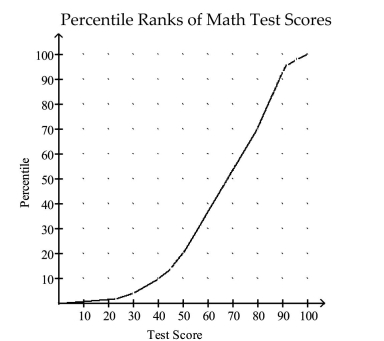 Use the graph to approximate the percentile rank of an individual whose test score is 60.
A) 37
B) 70
C) 42
D) 65
Correct Answer:
Verified
Q101: A severe drought affected several western
Q102: A student scores 56 on a geography
Q103: A study was designed to investigate the
Q104: Many firms use on-the-job training to teach
Q105: A television station claims that the amount
Q107: When results from a scholastic assessment test
Q108: The percentage of measurements that are below
Q109: Health care issues are receiving much
Q110: The percentage of measurements that are above
Q111: Solar energy is considered by many to
Unlock this Answer For Free Now!
View this answer and more for free by performing one of the following actions

Scan the QR code to install the App and get 2 free unlocks

Unlock quizzes for free by uploading documents