The graph below is an ogive of scores on a math test. The vertical axis in an ogive is the cumulative relativefrequency and can also be interpreted as a percentile. 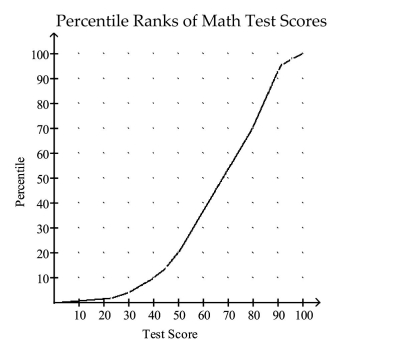 Use the graph to approximate the test score that corresponds to the 40th percentile?
A) 62
B) 10
C) 56
D) 15
Correct Answer:
Verified
Q111: Solar energy is considered by many to
Q112: The commute times (in minutes) of
Q113: The one way distances from work
Q114: A pharmaceutical testing company wants to test
Q115: A highly selective boarding school will only
Q117: Find the z-score for the value 96,
Q118: The grades are given for a
Q119: Jim buys his school supplies in bulk.
Q120: In a health food store, Jenny and
Q121: The test scores of 30 students
Unlock this Answer For Free Now!
View this answer and more for free by performing one of the following actions

Scan the QR code to install the App and get 2 free unlocks

Unlock quizzes for free by uploading documents