The Excel frequency bar graph below describes the employment status of a random sample of U.S. adults.What is the percentage of those having no job? 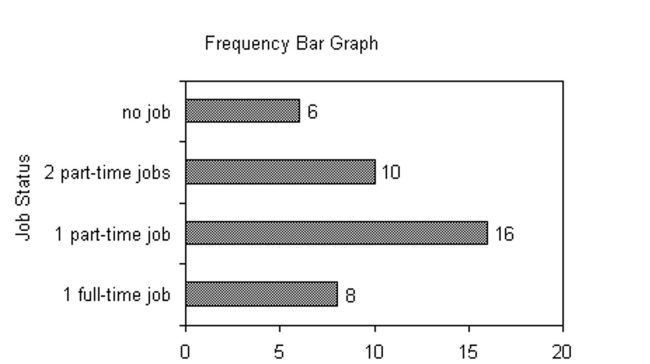
A) 15%
B) 20%
C) 40%
D) cannot determine
Correct Answer:
Verified
Q1: Student Council President Q3: Scott Tarnowski owns a pet grooming Q4: The bar graph below shows the political Q5: The results of a survey about Q6: The preschool children at Elmwood Elementary Q7: During which week was the fewest number Q8: The grade point averages for 40 Q9: The local police, using radar, checked Q10: True or False: Relative frequency is Q11: Approximately how many tickets were sold during![]()
Unlock this Answer For Free Now!
View this answer and more for free by performing one of the following actions

Scan the QR code to install the App and get 2 free unlocks

Unlock quizzes for free by uploading documents