A report in the Des Moines Register presented the average number of years ofteaching experience for the teachers in elementary schools in Des Moines, Iowa.These data appear in the table below. 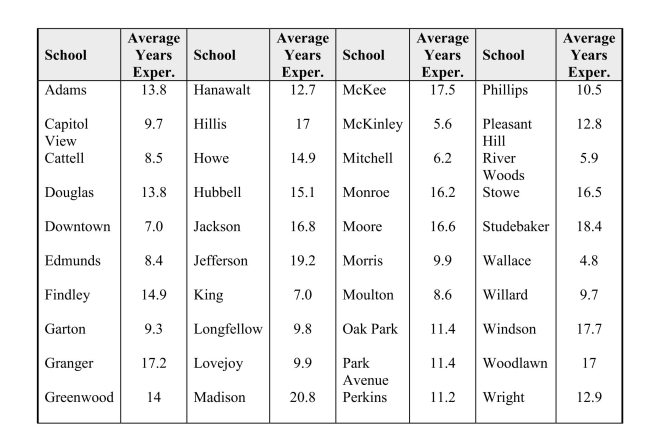 (a) Sketch a histogram for these data, using the following class intervals:0 to < 44 to < 8, etc.(b) Describe the distribution of the average number of years of teaching experience,and note any unusual features.problem #2 also reported thepercent of children eligible forFree and Reduced lunch to teacherexperience. The percent ofchildren eligible for Free/Reducedlunch is an indicator of the socio
Correct Answer:
Verified
b) This is a fairly s ymm...
View Answer
Unlock this answer now
Get Access to more Verified Answers free of charge
Q8: An outlier is a data value that
Q9: A univariate data set must contain numerical,
Q10: A time series plot is a graph
Q11: The article "New Rules Would Protect Students"
Q12: A pie chart is most useful for
Q13: Artificial bird nests have been used extensively
Q14: Hoofed animals such as cattle and sheep
Q15: A segmented bar chart uses rectangles rather
Q16: The Des Moines Register article in
Q17: In a histogram, class intervals are required
Unlock this Answer For Free Now!
View this answer and more for free by performing one of the following actions

Scan the QR code to install the App and get 2 free unlocks

Unlock quizzes for free by uploading documents