A report in the Des Moines Register presented on the percentages of students whoqualify for Free/Reduced lunch programs in the elementary schools in Des Moines,Iowa. These data appear in the table below. 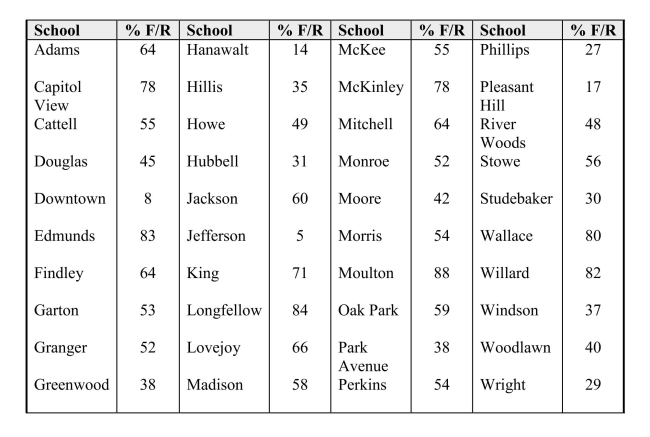 (a) Sketch a histogram for these data, using the following class intervals:0 to < 2020 to < 40, etc.(b) Describe the distribution of Free/Reduced eligibility percents, and note anyunusual features.
Correct Answer:
Verified
b) This distribution is very symmet...
View Answer
Unlock this answer now
Get Access to more Verified Answers free of charge
Q17: In a histogram, class intervals are required
Q18: A unimodal set of data is one
Q19: One of the "media messages" sent by
Q20: A bar chart is a graphical display
Q21: It is well known that the order
Q23: As part of the United States Census,
Q24: The Des Moines Register article in YearsExp
Q25: The average circumferences (distances around) in mm
Q26: A study by the National Bureau of
Q27: During the first six months of the
Unlock this Answer For Free Now!
View this answer and more for free by performing one of the following actions

Scan the QR code to install the App and get 2 free unlocks

Unlock quizzes for free by uploading documents